The Big Book of Dashboards – Visualizing Your Data Using Real–World Business Scenarios
L**O
Teaches through examples
Very nice book. I liked the fact that it gives good examples as well as bad examples. The bad examples are well selected so that you learn what to avoid.
A**Z
Excelente libro
Excelente libro, con ejemplos y paso a paso de como replicarlos
O**G
I learned a lot!
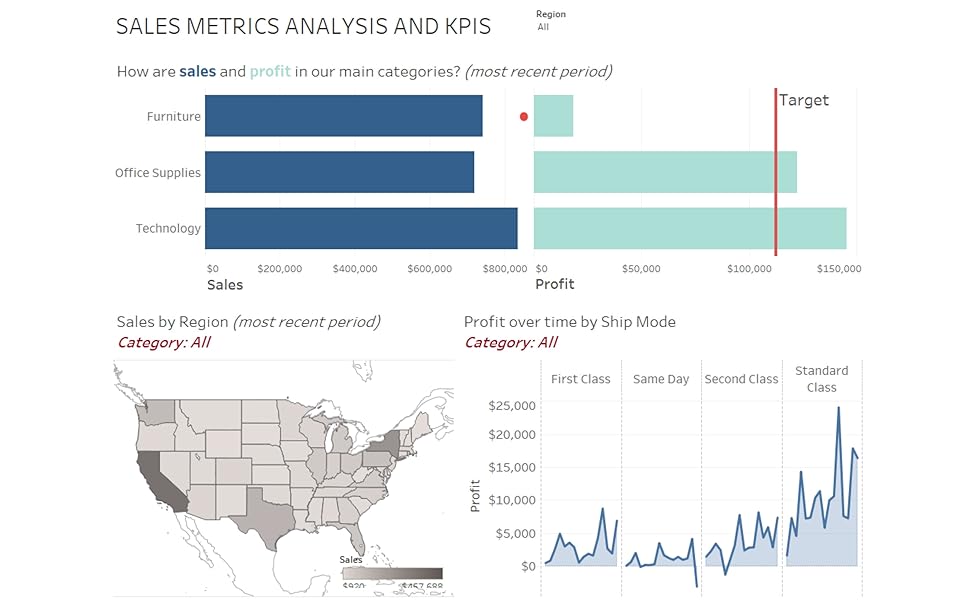
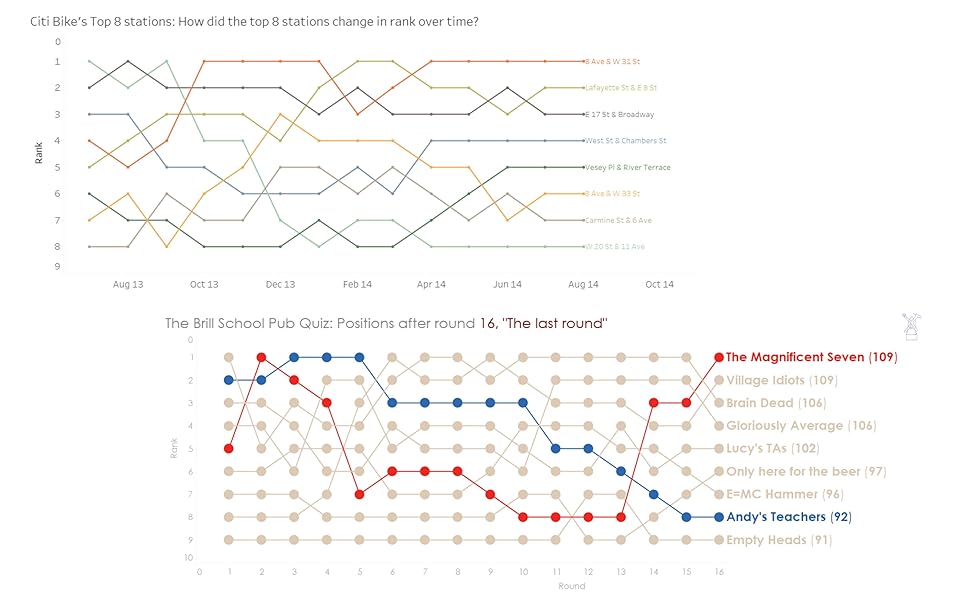
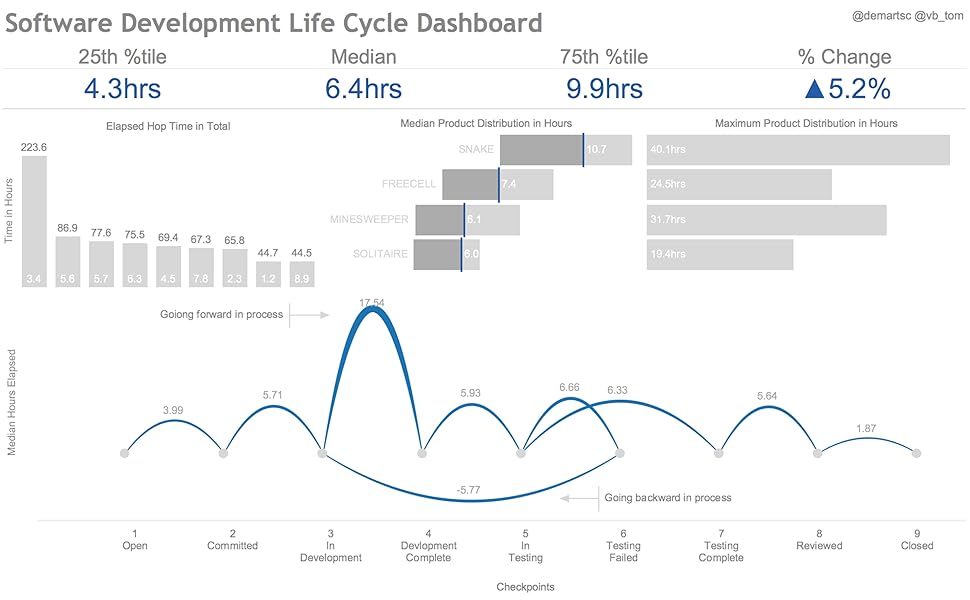
Reads very well and you can see yourself designing dashboards as you go through it. You can see the thinking, how each dashboard is used in real life, and alternatives. Because the dashboards are real, you learn something about the domain too - from sports to medical offices.
W**N
Avaliação
O livro te dá uma visão de Dashboard. Mais não tem um material para você acompanhar os exemplos, e claro aprender também a fazer.Do meu ponto de vista o livro agrega pouco valor. Visão de resultado quem procura um livro de dashboard já possui essa visão, a pessoa não possui a técnica de fazer. Geralmente o que as pessoas querem é aprender a fazer e não a olhar figuras.Do meu ponto de vista para que esse livro fique bom precisa de material como por exemplo, planilhas de Excel para complementar os exemplos do livro.
D**A
Want to advance your Tableau skills?
I strongly believe that this book can seriously advance your Tableau skills.But, in order to profit most from this book, you probably should be a Tableau power user. In Tableau terms, that’s being comfortable with all levels (I, II and III).I made the “mistake” of buying this book in 2017. My Tableau skills were simply not at par to profit from this book. Thus, the book remained in my bookshelf for quite a while.Conclusion: If you are Tableau power user, this book can boost your skills.Highlights:- The focus is on useful and beautiful dashboards, not info graphics.- The screaming cat is really funny.- So far, I’ve only used about 10% of the book. But those 10% were really worth it.- I tried to replicate some dashboards. Expect challenging tasks.- Page 15: How to use color for sequential, diverging, categorical….wow!- Page 339: Want to engage people? Excellent ideas.- Page 357: Are there cyclical patterns in my data? Amazing!- Page 368: Visualizing time. Some seriously good ideas.- Page 419: I love the glossary of chart types.A fantastic book to push your Tableau skills.
Trustpilot
4 days ago
2 months ago